| |
|
December 31, 2008
Customer Internet
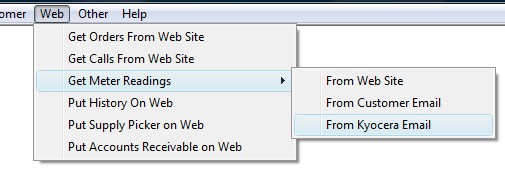
InterfaceYou can now
import meter readings directly from Kyocera machines. Click the Web
menu, Get Meter Readings, From Kyocera Email. You can also import
readings directly from the RCS generated request for meter readings.
When importing, the meter readings go directly to the "enter readings"
area of the contract billing system and you do not have to manually enter
the readings.
If your product line can send emails
(or spreadsheets) of meter readings, send us some examples so they can be
added to the import menu.
Payroll
The new payroll is now ready.
You can now have unlimited
withholdings, expenses, and deductions.
You can print time card labels, enter
hours from time cards and even import time card data from clocks that will
export the time card information by employee. The time card data is
kept with the check history if you ever need to review it
again.
Store a picture of the employee and
print employee name badges ready to be laminated.
Maintain absences. For example,
allocate hours to vacation, sick, etc. As the hours are used, it
will reduce the allocation. Easily see how much time an employee has
left for paid leave. Add leave allowances either individually or
globally. For example, add 20 hours vacation time to every employee
or reset the vacation time to 20 hours.
The payroll can now be used for other
countries besides the US. The payroll calculations are actually kept
in a spreadsheet that is executed by the program for each withholding,
expense, and deduction.
There is a conversion process.
Call or email our support department to guide you thru the conversion
process.
Accounts
Receivable
When invoicing for a drop ship item
and you set the printable item number on the purchase order, the system
will add the vendor and printable item to the alternate suppliers
for the item. The next time you order from that vendor, their item
will be the printable item number.
Purchase
Order
The alternate supplier table is now
being updated as purchase orders are received and you enter the vendor's
item number in the printable item area of the purchase order detail.
(See accounts receivable above).
General
Ledger
Added an accounts receivable audit
function under journal entries. This will compare the accounts
receivable transactions to the posting entries to the accounts receivable
general ledger number by day. These two entries should be the same,
but in you create an invoice on Monday and run the invoice register on
Tuesday, it will be different since the journal entry to the general
ledger system happens on the invoice register. If you print invoice
now, the journal entry will be on Monday.
Service
Text messaging has now been moved to
the main service program. You do not need to run the separate text
messaging program. You can set the text messaging values by going to
Service/Contract billing, Other, Options. There is a tab for text
messaging now.
Sales
Prospecting
The salesrep statistics report graph
has been re worked into the latest graphing routines.
Financial
Manager
New analysis reports and graphs have
been added to the financial manager section.
Calculate profitability by
list. Used to find our which customers
are below or above a profitability percent. This can be done by
equipment, service, other, or total profitability in the date
range
Previous list.
Display the previous list created. The list is saved by
station.
Analyze
customer. Will graph and show details of equipment,
service, other, and total profit by customer. Search for a
specific customer, click the analyze button on the display customer, or
double click on a customer from the list above.
Top/Bottom customers.
Find your top or bottom customers in terms of sales. You
can find top count or percent. For example, 10 count to give the
top 10 customer (or bottom 10). Use 10 percent to find top or
bottom 10 percent.
First time customer.
This report gives you any customers whose first sale was in the
date range. The screen will display that first
invoice.
Returning customers.
This report gives you customers who made a purchase in a given
date range where the last purchase was in a different date
range.
Sales graph snapshot.
Gives a graph and details of total sales, by rep, by category,
and by rep/category for each of the previous 24
months.
Cost graph snapshot.
Gives a graph and details of total costs, by rep, by category,
and by rep/category each month for the previous 24
months.
Profit graph
snapshot. Same as above but for profit.
Inventory
Analysis. Shows inventory usage for a date range by
category detailing price, cost, and profit.
Service
Manager
New analysis and graphs have been
added to the service manager section.
Tech call analysis.
Shows calls, partial completes, call backs, average repair,
average travel, average miles per day for techs in a given date
range. This can be graphed as well. Double click on the
column heading to graph that one column.
Machines with no
service. All machines that have not had a service call
since a given date.
Excessive Calls. Machines that have had more than the give service calls in the
given date range. For example, all machines that have had 4 calls
in the last 35 days.
Create Survey List.
Send an email survey to customers that have had a service call
in the date range. The email survey is created as an email
template in the sales prospecting
section.
Previous Newsletters
Click on a link to view previous newsletters
Subscription Request
| |


